USDA WASDE Report Archives | Grain Brokers Australia

USDA welcomes the New Year with very little fanfare…

Posted by | USDA WASDE Report, Weekly Commentary | No Comments

Released late last week, the January World Agricultural Supply and Demand Estimates (WASDE) report tends to be quite significant, given that it’s usually the final numbers in terms of yields, harvested area and production for the crop year in the United States (US). 

However, the case is not closed on 2019 US production just yet as the United States Department of Agriculture (USDA) acknowledged it would resurvey producers in Michigan, Minnesota, North Dakota, South Dakota and Wisconsin for corn production and Michigan, North Dakota and Wisconsin when it comes to soybean production.

Heading into last Friday’s release, much of the market chatter suggested that the report would be bullish, based on the expectation of lower summer crop yields. But the opposite happened with the USDA raising the national yield for both corn and soybeans.

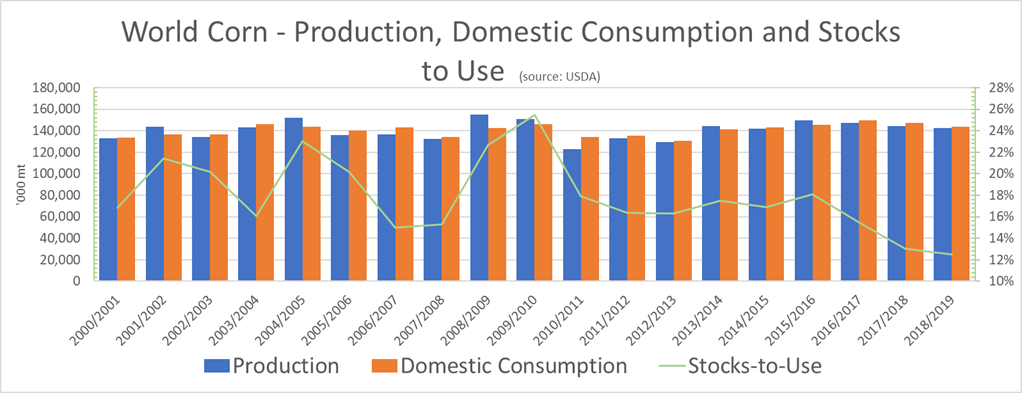
US corn production was forecast at 347.7 million metric tonne (MMT) with an average national yield of 10.55 metric tonne per hectare (mt/ha), slightly higher than last month’s yield estimate of 10.48mt/ha.

Globally, corn production in South America was left unchanged by the USDA with Brazil and Argentina forecast to produce 101MMT and 50MMT respectively. These numbers seem to belie the dry conditions being experienced in many parts of Brazil and Argentina this summer.

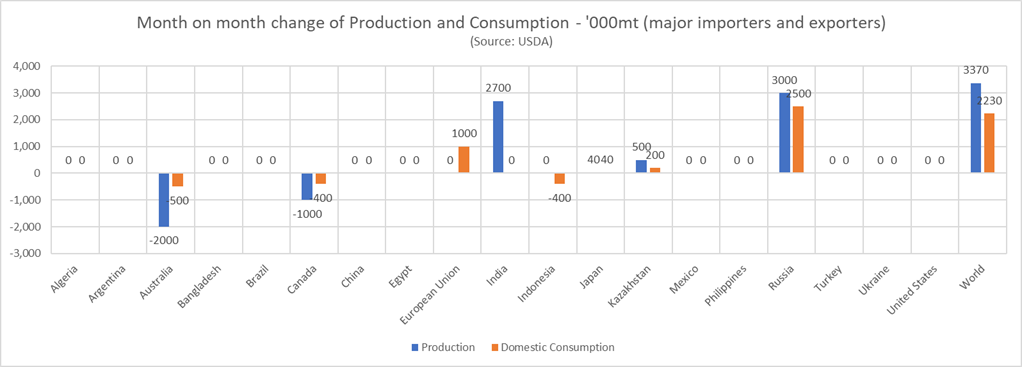
The only production increase amongst the major exporters was Russia which the USDA increased by 0.5MMT to 14.5MMT. The washup of all the changes was an increase in global output by a little more than 2 MMT to 850MMT excluding China, and 1,111MMT including China.

However, the bullish part of the corn equation comes in the demand number, increased by more than 6MMT globally compared to the December report. The US accounted for just under 6MMT with a 1MMT increase in China countered by a 0.5MMT decrease in Ukraine and several other minor downward revisions.

The USDA pegged final 2019 US soybean production 90.4MMT, on an average yield of 3.19mt/ha compared to 90.2MMT and an average yield of 3.15mt/ha in the December report. This was a surprise to most analysts who expected to see the impact of the extremely challenging season continue to ripple through the country’s soybean supplies. Nonetheless, this is still 20 per cent lower than the previous season’s production of 112.5MMT.

Like corn, the South American soybean production numbers remain steady with Brazil estimated to produce 123MMT this summer and Argentina expected to harvest 53MMT. Brazil’s National Supply Company (Conab) released estimates last week that seem to ignore drought worries and support the USDA number. They are forecasting soybean production at 122.2MMT off 36.8 million hectares.

Eventually, soybean losses will happen if it remains dry, but most agronomists believe that the current lack of moisture only affects the first corn crop at this point in the season. The state raising the biggest concern is Rio Grande do Sul, the top summer corn producer in the country. Conab maintained its estimate for first crop corn production at 26.6MMT, down 3.8 per cent compared with 2019, based on a 1.1 per cent increase in the seeded area.

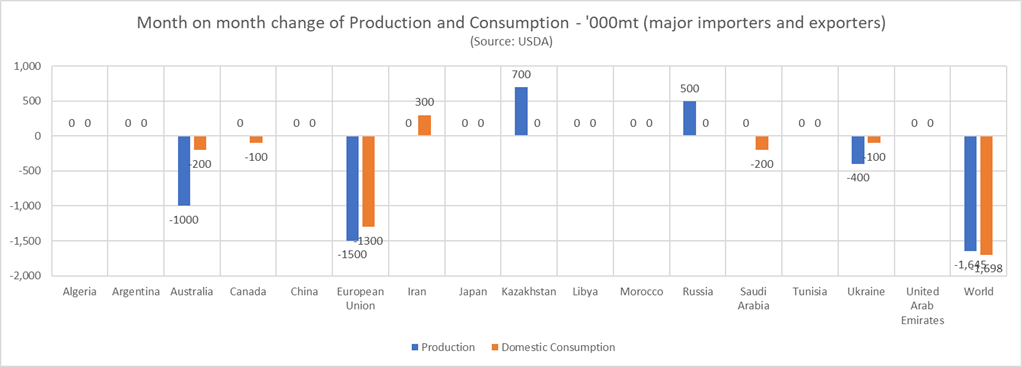
When it comes to wheat, global production for the 2019/20 marketing year was reduced by a meagre 1MMT to 764.4MMT. Half of that decrease was in Australia, where the USDA decreased production by 0.5MMT to 15.6MMT. While this is getting closer to reality, it is still at least 1MMT higher than the majority of domestic estimates.

Argentine production remained at 19MMT against the latest Buenos Aires Grain Exchange (BAGE) estimate of 18.8MMT. BAGE increased their estimate by 0.3MMT last week on the back of better than expected yields in the late-harvested regions. The balance of the global production decrease was in Europe with the Russian crop decreased by 1MMT to 73.5MMT and the European Union (EU) crop increased by 0.5MT to 154MMT.

On the wheat export front, global trade for the 2019/20 marketing year was increased by 1.3MMT to 181.1MMT. The US, Argentine and Canadian numbers were all unchanged compared to the December report. The major tweaking was in Europe where the Ukrainian and EU export numbers were increased by 0.5MMT and 2MMT respectively, and the Russian forecast was decreased by 1MMT on the back of lower supplies.

The USDA adjustment to the Australian wheat export number was hardly worth the token effort with a mere 0.2MMT shaved off expectations. Like the production forecast, the figure of 8.2MMT is at least 1MMT higher than most domestic expectations, and it simply should not be possible given domestic demand and the poor harvests receivals in Western Australia and South Australia.

Looking at the US new crop, the USDA reckons their farmers have planted 12.47 million hectares of winter wheat. This compares to 12.61 million hectares last year and is the smallest winter wheat area since 1909.

On the barley side of the equation, global production was decreased by 0.7MMT to 156MMT up more than 12 per cent, or 17.4MMT compared to the 2018/19 season. Australia was down 0.2MMT to 8.2MMT, EU up 0.5MMT to 62.75MMT and several minor producers collectively down by 1MMT.

The net change to global demand was minor at 0.1MMT, but the USDA did make some quite hefty regional adjustments to arrive at total demand of almost 153MMT. The big one was a 0.9MMT decrease in Chinese demand, potentially decreasing Australian exports over the coming months.

Countering that were demand increases of 0.4MT in the European Union and 0.6MMt in Turkey. Most importantly, Saudi Arabian demand was untouched at 8.5MMT, a year-on-year increase of 20 per cent or 1.5MMT. All this leaves 2019/20 global ending stocks at just under 21MMT, down 1MMT on last season’s number.

It could be said that last week’s WASDE report was mildly bullish for wheat, barley and corn, but on the whole, it was quite underwhelming for a report that invariably has huge trade and market ramifications.

Read the full USDA report here.

Global grain markets looking for direction after benign WASDE report…

Posted by | Grain Brokers Australia News, USDA WASDE Report, Weekly Commentary | No Comments

The United States Department of Agriculture (USDA) released their November World Agricultural Supply and Demand Estimates (WASDE) to the market last Friday (Saturday morning down under) and there was nothing to get the trade, or futures markets, too excited.

Chicago Board of Trade (CBOT) December wheat futures closed the week at 510¼ cents per bushel (c/bu), down 2¼ c/bu on the day and down 5¾ c/bu for the week. Wheat futures have been trending downward since a 3-month high of 532¼ c/bu was set on October 18. That equates to a fall of almost AU$12 over the last three weeks.

The December corn futures contract closed last Friday’s trade at 377¼ c/bu, up 2 c/bu on the day but down 12 c/bu for the week. The soybean contract for November closed at 919½ c/bu, down 5½ c/bu on the day and down 4¾ c/bu for the week. Like wheat, both corn and soybean futures have been trending lower in recent weeks and have lost the equivalent of just under AU$12 and just over AU$11 respectively since the highs of mid-October.

The WASDE wheat production numbers were basically a juggling act, the result being a small global increase of around 0.3 million metric tonne (MMT). Australian production was decreased by 0.8MMT to 17.2MMt, similar to last year’s final number. However, this is still around 1.5MMT above many domestic trade estimates, and a further reduction is expected in the next report, due for release on December 10.

Argentine wheat production was decreased by 0.5MMT to 20MMT. Like Australia, this is around 1.5MMT above the most recent estimates emanating from the South American republic. Last season’s production was 19.5MMT. Reaping has commenced in many parts of the country, and the Buenos Aires Grain Exchange called the wheat harvest 7 per cent done compared to 11 per cent at the same time last year.

The United States (US) was the other major wheat producer which saw production fall compared to last month. The USDA pegged 2019/20 production at 52.3MMT, a decrease of 1.1MMT, but still, 1MMT higher than last season.

Planting of the next US winter wheat crop is well underway with 94 per cent expected to be planted by early this week. This compares to 89 per cent last week, 85 per cent last year and 92 per cent on average. Crop ratings are expected to be unchanged week-on-week at 57 per cent good to excellent, versus 51 per cent last year.

On the positive side of the equation, Ukraine, Russia and the European Union (EU) all saw increases to their final wheat numbers for the 2019/20 season compared to the October report. Ukraine production was increased by 0.3MMT to 29MMT. This represents a significant year-on-year increase of 4MMT, or 16 per cent.

The USDA increased Russian production by 1.5MMT to 74MMT. Here again, the USDA appears to be conservative with their revised estimate as local Russian forecasts are around 1-2MMT higher. That said, it is still around 2.3MMT higher than 2018/19 production.

The most significant increase to global wheat numbers in Friday’s WASDE report came in the EU. Production was posted at 153MMT, an increase of 1MMT compared to October and an increase of 16MMT compared to last season. However, the USDA number is 3MMT lower than the most recent European Commission wheat forecast of 156MMT.

In France, the European Union’s biggest wheat producer, planting of the winter wheat crop is delayed by wet weather. The French state grains board, FranceAgrimer, estimates that 67 per cent of the soft wheat crop has been planted, up 13 per cent on the previous week, but still well behind the long term average of 82 per cent.

With global wheat demand remaining static, the washup of all of the production changes was an increase in world ending stocks to a record 288.3MMT, 142.6MMT (49 per cent) of which is held outside of China.

On the barley front, the WASDE report was slightly bullish. The USDA cut Australian production by 0.2MMT to 8.4MMT. While this may be achievable, it appears to be on the high side based on the hard finish experienced in almost all the major barley production regions of the country.

Elsewhere, Argentine production was decreased by 0.1MMT to 4.7MMT (5.1MMT last year), the EU was raised by 0.2MMT to 61.8MMT (55.9MMT last year), and Ukraine was increased by 0.3MMT to 9.5MMT (7.6MMT last year).

The USDA increased global barley demand by 0.8MMT, predominantly in Russia, Ukraine and EU and world ending stocks were decreased by 0.8MMT, mostly in Russia and Saudi Arabia. Australian barley exports were reduced by 0.2MMT to 4.3MMT, and China’s barley imports were cut by 0.2MMT to 6.3MMt (5.5MMT last year).

There were several decreases to global corn supply, but most had already been factored into trade calculations, hence the subdued futures market reaction. US production was down by 3MMT after the yield forecast was decreased to 167 bushels per acre (10.5 metric tonne per hectare). Mexican, Ukraine and EU production were cut by 2MMT, 0.5MMT and 0.2MMT respectively, and Russian was increased by 0.5MMT.

US corn demand was down by 1.2MMT, but world demand was increased by 0.8MMT compared to the last WASDE report. World ending stocks are forecast to decrease by 6.6MMT, predominantly in Brazil, China, EU and the US.

The soybean numbers were quite benign, with global production down by 2.4MMT, mainly in India and Canada, and global demand down by 2.4MMT, primarily in India, China and the United States.

The grain market needs news, and the WASDE report provided nothing that wasn’t already known and factored into global thinking. From a wheat and barley perspective, 2019/20 production is basically known, even though the USDA numbers still need a little tweaking in several key jurisdictions.

A resolution, or otherwise, to trade disputes involving China is a key driver in the near term. The big one, of course, is the US standoff, with Trump seemingly dousing the most recent positive news with his usual Twitter diplomacy.

Call your local Grain Brokers Australia representative on 1300 946 544 to discuss your grain marketing needs.

USDA WASDE Report – Special Market Strategy Update, 14 September 2018

Posted by | USDA WASDE Report, Weekly Strategy Market Update | No Comments

USDA WASDE Report – Special Market Strategy Update


The USDA WASDE report is out and as with last month, provided some fairly US-centric views of expected changes to global trade in 18/19.  The vast majority of the changes to the global balance sheet were reflected in the US with general increased production potential.  A few surprises out of the FSU region has the market scratching its head.  Overall the report on the surface is slightly bearish given the numbers, however, the view of many in the market is the underlying tension on export demand continues for cereals.  Oilseeds continue to be mired by the trade tensions between the US and China providing little clarity in price direction.

On the domestic front the trade are working on the task of feeding eastern Australia for the coming season.  With significant supply deficiencies in eastern Australia, the logistic task of moving grain west to east, south to north continues by road, rail and ships.  There is also talk of the eventual importation of feed from overseas with expectations of Canadian wheat and US corn being sourced to feed domestic capital city markets.  As noted in the last message to growers there is to some degree a tendency at the moment to dismiss the current global situation, as for much of Australian production, the focus is purely on the deteriorating domestic situation.  While this is the main price driver locally at present we need to be slightly cautious on how buoyant we get on price support coming into harvest and the new year.  Domestically, much depends on the spring weather (not looking great so far) and any potential for upside in production or further deterioration of the crop.  At some point either domestic prices will get high enough to promote importing feed (import parity) or global values sink lower enough to do the same.  Either way this market is close to import parity levels and general consensus is, when the domestic supply is sorted out one way or another by the consumer, prices will come back.  In the past we have seen prices come down swiftly at this point.


Wheat

The outline of monthly changes by the USDA in the September report for major wheat importing and exporting nations is shown in the chart below.  Given the recent well-publicised production issues in major production regions of the world, the increase by the USDA in world production by 3.37Mmt has a few scratching their heads.  Production estimates for the 18/19 season was lifted in India (up 2.7Mmt), Kazakhstan (up 500Kmt) and Russia (up 3Mmt).  Production estimates were decreased for Australia (down 2Mmt to 20Mmt – still likely around 2Mmt too high with ABARE alone at 19.1Mmt) and Canada (down 1Mmt).  There has also been a change in imports by Indonesia indicated for this season, dropping 1Mmt to 10.5Mmt.  Exports from Australia were dropped by 2Mmt to 14Mmt – still well over current trade estimates of 11.5-12Mmt, Canadian exports were lowered 500Kmt.

The USDA has made some interesting changes to domestic consumption which contributes to the seemly bearish numbers from the report.  Australia domestic consumption was reduced by 500Mmt, to 7.6Mmt (around 1Mmt lower than current trade estimates).  Domestic consumption was also lower in other significant regions; Canada down 400Mmt and Indonesia down 400Mmt.  Conversely, domestic consumption was also increased in significant regions; the European Union (up 1Mmt) and Russia up 2.5Mmt. As a result of the changes, and quite perversely in some instances, ending stocks were increased in Australia (up 1Mmt), India (up 2.3Mmt), Kazakhstan (up 300Mmt) and Russia (up 2.05Mmt).

So, overall despite USDA reporting, world production will decline 25.2Mmt year on year, domestic consumption increasing 4.6Mmt year on year and ending stock declining 13Mmt year on year, the world stocks to use ratio remains comfortably at 35.13%, up 21 points on last month’s report.

Over the last few reports, we have been talking about where global wheat stocks are located with the emphasis being on the vast majority of world wheat stocks being held in China.  This effectively means the majority of world wheat stocks are not available for export.  The chart below shows the impact of the stock’s position of major importers and exporters as a result of the latest USDA WASDE numbers.  We can see the balance sheet has loosened up a little and on the surface contributes to the bearish theme of the latest report.  There are a few factors that need to be considered in focusing on the potential price drivers in this scenario.  As we have been hearing and reading there is a very good chance that Russia will restrict wheat exports at some stage this year or very early in 2019.  Russian export pace has been phenomenal with exporters rushing to make sales and execute before any government intervention.  Current estimates cap Russian exports for the season at 35Mmt (USDA), a 6.4Mmt year on year decline.  IGC are currently forecasting 30.7Mmt.  Once Russian exports are exhausted, demand will shift to the US providing expectations of price support.

As we have seen with the US/China trade dispute, any major government intervention in world trade flows can have a significant impact on global prices.  Currently, the USDA report has likely dampened the market in the short term – on the back of expectations of increased global stocks in major exporting regions.  We do however believe longer-term fundamentals will prevail with a shift in export demand to the US and resulting price support into the new year.


Barley

The world barley balance sheet continues to be historically tight, supported also by an overall historically tight coarse grains balance sheet. As with wheat, the latest USDA report lifted production estimates in the Black Seas region which, in the case of barley has offset some of the declines seen in EU and Australia.  While USDA reduced Australian barley production by 1Mmt to 7.8Mmt, this is still around 1Mmt over current trade estimates.  Australian exports are predicted to be around 5.8Mmt, again higher than current trade estimates of around 3.6Mmt.

We are also seeing the tight global supply and resulting global price situation in barley rationing demand.  A shift that is seeing a resulting lift on global corn consumption and provided a slight lift in the world stock-to-use for barley in the latest report.

Significant observations from the USDA report for corn show production in the US and EU was lifted 6.1Mmt and 1Mmt respectively.  European imports were lifted 1.5Mmt and US exports were lifted 1.27Mmt.  Domestic consumption was also lifted 3.5Mmt in EU, a 6Mmt jump year-on-year.  Similarly, US domestic consumption was lifted 1.9Mmt, a 4.95Mmt lift year-on-year.

Overall global coarse grain stocks continue to be tight with ongoing price support expected for barley in 18/19.  Our domestic market will continue to be supported by internal requirements.


Canola

The soybean balance sheet continues to remain loose with the USDA report seeing little month-on-month change from a global perspective.  Year-on-year changes continue to pressure soybean prices with world production up 32.5Mmt and ending stocks expected to increase to by 13.5Mmt.   US production was lifted 2.9Mmt from the last report (with ending stocks up 1.6Mmt) and China’s imports reduced a further 1Mmt the soybean market remains under pressure.  Overall the world total oilseed balance sheet remains weighty.

The canola balance sheet shows a little of the opposite.  World canola production was reduced 450Kmt month-on-month for major importers and exporters in the latest report, but this has been offset by the 825Kmt decline in domestic consumption expected in the major importing and exporting regions.  Surprisingly, USDA left Australian Canola production unchanged at 3.2Mmt, or close to 1Mmt over current trade estimates and exports at a heady 2.6Mmt.  Overall expected world production of canola in 18/19 has declined with the stocks-to-use falling 41 points to 8.4%.

Canola will remain challenged by the headwinds of the heady global overall oilseed balance sheet and the continued consternations of the US/China trade tiff.  The tightening global canola balance sheet combined with the challenging production season domestically would be expected to continue to provide some underlying price support for canola into the 18/19 season.

USDA WASDE Summary 12/12/16

Posted by | Grain Brokers Australia News, Misc, USDA WASDE Report | No Comments

The latest USDA Report for December was released on Friday, and globally the USDA Report was overwhelmingly bearish across all commodities. However, the US ending stocks of the key commodities were kept unchanged despite expectations that they might have increased, which combined with fund buying led to a jump in most futures. Globally, wheat jumped a solid 6.5 million mt of which 4.7 million mt was in Australia at 33 million mt. Corn production was up in several countries but lower than expected US stocks supported prices overnight. Beans were also up solidly on the production side but it was almost matched by a similar increase in demand.  Overall, the report was more of the same with big crops so the market will likely digest it pretty quickly.

WHEAT           BEARISH

  • World production UP 5 million mt – key changes:
    • Australia UP 7 million mt to 33 million mt.
    • China UP 85 million mt.
    • EU UP 4 million mt.
    • Brazil UP 36 million mt.
  • Consumption UP 2 million mt (mainly in Australia, Russia and China).
  • Stock levels UP 9 million mt and stocks to use ratio UP 24 points to 34.08%.

BARLEY           SLIGHTLY BEARISH

  • World production UP 7 million mt – most in Australia and Canada.
  • World demand UP 3 million mt.
  • World stocks UP 28 million mt with stocks to use ratio UP 16 points to 15.85%.

CORN              BEARISH

  • World production UP 2 million mt – with key changes:
    • China UP 55 million mt.
    • Brazil UP 3 million mt.
    • Russia UP 1 million mt.
    • Canada UP 7 million mt.
    • Indonesia UP 6 million mt.
    • EU UP42 million mt.
  • World demand UP 7 million mt – mainly in the China and Indonesia.
  • World stocks UP 4 million mt – mainly in China and Brazil.
  • World stocks-to-use ratio UP by a 30 points to 21.65%.

SOYBEANS      BEARISH

  • World production UP 9 million mt – most of it in India and Canada.
  • World demand UP 9 million mt.
  • World stocks UP by a massive 1.3 million mt (in Argentina and India).
  • World stocks-to-use ratio UP 27 points to 28.85%.

USDA Summary – October

Posted by | Grain Brokers Australia News, Misc, USDA WASDE Report | No Comments

OCTOBER USDA WASDE REPORT SUMMARY

USDA report mainly bullish grains and bearish oilseeds. Wheat saw another month of support with less production, more consumption and less stocks, whilst the USDA lifted the Australian wheat production by 0.8 million MT from last month (we believe they are 2 million MT on the high side for AUS).  Barley continue to get tighter every month in these reports, and this month was no exception with production down, consumption up and stocks down.  Globally corn saw lower production in the US and a better Brazilian crop could not help that. Stocks of corn are down 2.6 million MT this month. Beans were the most bearish with record US yields and higher global production by 2.8 million MT. Ending stocks jumped 5.1 million MT.

WHEAT             BULLISH

  • World production DOWN 4 million mt.
  • Biggest changes
    • Australia unexpectedly UP8 million mt. This should definitely change once harvest gets going.
    • Canada UP 1 million mt.
    • EU DOWN 2 million mt.
    • US DOWN 3 million mt.
  • Consumption UP Close to 1 million MT (US consumption down close to 2 million MT)
  • Stock levels DOWN 7 million MT and stocks to use ratio down 5 point to 33.76%

BARLEY             BULLISH

  • World production DOWN close to 1 million MT (mainly in Russia and EU)
  • World demand UP close to 0.5 million MT
  • World stocks DOWN 5 million MT with stocks to use ratio down a solid 32 points to 15.61%

CORN                BULLISH

  • World production DOWN close to 1 million MT (mainly EU and US whilst Brazil actually up 1 million MT)
  • US yields now forecast at 173.4 bu/acre
  • World demand DOWN 5 million MT – mainly in the EU and “Other” countries
  • World stocks DOWN 6 million MT
  • World stocks-to-use ratio DOWN 31 points to 21.28% (and US ending stocks projected to be down as well)

SOYBEANS        BEARISH

  • World production UP 8 million MT – (US up 1.8 million MT and Brazil up 1 million MT)
  • US yields up to 51.4 bu/acre
  • World demand DOWN 5 million MT
  • World stocks UP by a massive 5.1 million MT (in Argentina, Brazil and China)
  • World stocks-to-use ratio UP 185 points to 27.06%

September USDA Summary

Posted by | Grain Brokers Australia News, Misc, USDA WASDE Report | No Comments

The USDA report was mostly bearish with a few surprises. Wheat took a good chunk out of ending stocks again by reducing EU, India and China down solidly (and Australia up).  USDA left US wheat ending stocks unchanged. Corn saw global production and ending stocks down, and in particular we saw US corn yields down from the August estimate which took a good chunk out of US production – most of it expected though so market did not react much. Beans saw the biggest surprise with US yields up well more than most traders expected – and a resulting 3.8 MMt increase in US production.

WHEAT             BULLISH – CBOT SRW DEC UP 5.80 USc/bu

  • World production for 16/17 UP 4MMt. EU (2.2MMt) & China (2MMt) both DOWN. Kazak (1.5MMt), Russia (7MMt) Aus (1MMt) India (2MMt) all UP.
  • World consumption UP 1MMt (Mostly India & Morocco.)
  • World stocks-to-use ratio DOWN again to 33.81%. (Fourth downward revision in a row).

BARLEY             BULLISH

  • World production DOWN 5MMt (Mainly EU & Russia).
  • World demand UP 13MMt.
  • World stocks DOWN25MMt.
  • World stocks-to-use ratio DOWN 19 points to 15.92%

CORN              NEUTRAL to BULLISH – CBOT Corn DEC DOWN 1.60 USc/bu.

  • World production DOWN 7MMt (Mostly China, U.S & EU)
  • World demand DOWN5MMt (Mostly U.S & EU).
  • World stocks DOWN4MMT.
  • World stocks-to-use ratio DOWN 12 points to 21.59%.

SOYBEANS        BEARISH – CBOT Soybeans NOV DOWN 16 USc/bu.

  • World production UP12MMt (Majority US which is UP 3.8MMt).
  • World demand DOWN1MMt.
  • World stocks UP9MMt.
  • Stocks-to-use ratio UP 42 points to 25.20%.

August USDA WASDE Report Summary

Posted by | Misc, USDA WASDE Report | No Comments

The USDA report was overly bearish with a few surprises although not enough to significantly shift markets. Most changes were U.S. based and were the main driver for increases to global stocks-to-use ratios. With no significant threats forecasted Southern & Northern Hemisphere crops we pretty well know we will need a large and dramatic shift in demand or a major problem to occur within the row crops to break out of these low prices.


WHEAT            Bearish – CBOT SRW SEPT Down 1.50 USc/bu

  • World production for 16/17 UP up 5MMT. EU DOWN 9MMT, Ukraine/Kazakhstan UP 2MMT ea, Russia UP 7MMT, Australia/Canada UP 1MMT ea.
  • World consumption UP 3MMT ( Mostly Russia & U.S.)
  • World stocks-to-use ratio down again to 34.52%. (Third downward revision in a row).

BARLEY           Bearish

  • World production UP 1MMT (Mostly Australia, Russia & Canada).
  • World demand UP 25MMT.
  • World stocks UP7MMT.
  • World stocks-to-use ratio UP 44 points to 16.11%

CORN                Bearish – CBOT Corn SEPT UP 1.50 USc/bu.

  • World production UP 17MMT (Majority U.S.).
  • World demand UP7MMT (Mostly U.S.).
  • World stocks UP4MMT.
  • World stocks-to-use ratio UP 107 points to 21.71%.

SOYBEANS       Neutral to Bearish – CBOT Soybeans SEPT DOWN 0.25 USc/bu.

  • World production UP4MMT (Majority US).
  • World demand UP5MMT.
  • World stocks UP
  • Stocks-to-use ratio UP 140 points to 24.78%.

JUNE USDA WASDE REPORT SUMMARY

Posted by | Grain Brokers Australia News, Misc, USDA WASDE Report | No Comments

Not a report full of surprises on Friday night, more just in line with expectations. Wheat saw big increases in production, but nothing that we didn’t know beforehand. HRW wheat also got a boost of production. Beans and Corn ending stocks cut in the US, but as global figures were cut less than expected, no real change there.

Wheat            Neutral to Bearish – CBOT SRW JUL Down 15c

  • World production for 16/17 up nearly 4 million mt, comprising mostly of the US, EU and Russia.
  • World consumption up 3.4mmt, mainly India, the EU and the US.
  • World stocks to use ratio down slightly to 36%

Barley                        Neutral to Bearish

  • World production up 3.1 million mt, mostly EU and Ukraine
  • World demand up 2.7mmt, mostly EU, Saudi Arabia and Iran
  • World stocks up .6mmt
  • World stocks to use ratio up slightly to 16.41%

Corn               Neutral to Bearish – CBOT Corn JUL Down 3c

  • World production up 0.7 million mt – All Mexico
  • US ending stocks below traders estimates
  • World demand up 1.2mmt – mostly US
  • World stocks down 2 million mt
  • World stocks-to-use ratio down to 20.25%

Soybeans        Neutral to Bullish – CBOT Soybeans JUL Up 1c

  • World production down 0.5mmt
  • World demand up 0.6mmt
  • World stocks down 2mmt
  • Stocks to use ratio down a considerable 72 points to 23.12%

Nic Sewell

Book Your Free Farm Visit or call us on 1300 946 544 for more information. Free Farm Visit