Weekly Commentary Archives | Page 3 of 9 | Grain Brokers Australia

Who holds the Trump card in the ongoing trade war?

Posted by | Weekly Commentary | No Comments

World agricultural commodity markets look set for continued volatility as the trade truce between the United States (US), and China appears to be dead in the water. Late last week both Washington and Beijing released statements suggesting that a deal to end the bitter trade dispute was unlikely in the short term.

Negotiations have been at an impasse since May with both sides claiming the other reneged on provisions of a tentative deal. Tensions escalated last Thursday when The Don (Trump) announced, via Twitter, a new tariff of 10 per cent on US$300 billion worth of Chinese imports that aren’t already subject to US duties.
This is on top of the US$250 billion worth of Chinese imports that are already subject to a 25 per cent tariff imposed mid-way through last year. The new tariff is set to come into effect on September 1.

It was no surprise to see China respond to the latest announcement by saying that they would take all counter-measures necessary as a result of the escalation in the trade conflict. However, the trade imbalance is a huge challenge for China. Washington has the potential to tax around US$540 billion worth of Chinese imports, but Beijing only has around US$120 billion worth of US goods it could target.

That said, President Xi Jinping does hold one significant trump card. China controls more than 90 per cent of the world’s production of rare earths, a group of 17 metals with magnetic and conductive properties that power most of the globe’s electronic devices. More importantly, it also accounted for 80 per cent of all US rare earth mineral imports between 2014 and 2017.

Chinese imports of US agricultural commodities have fallen dramatically as a result of Don’s Party (the trade war). Beijing retaliated to the initial round of US duties by slapping a 25 per cent tariff on a long list of US goods, including soybeans, in July 2018.

China is by far and away the world’s biggest importer of soybeans. The burgeoning demand for soybeans in China over the last ten years has been driven by an explosion in demand for meat as consumers shift from a diet dominated by rice to one where pork, poultry and beef play an increasingly important part.

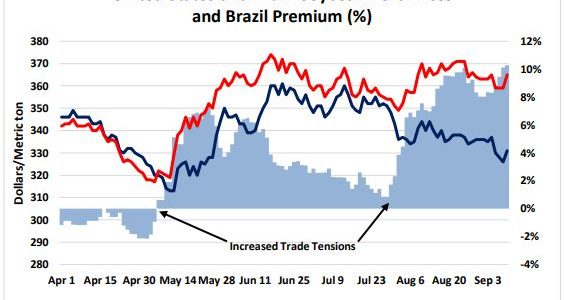
In 2017, Brazil and the US were the two biggest soybean exporters, totalling US$25.7 billion and US$21.4 billion respectively. China accounted for two-thirds of global trade, importing US$39.6 billion worth of beans. In the same year, US exports were around a third of Chinese soybean purchases. At just under US$14 billion, soybeans were the second most valuable US export to China, behind aeroplanes.

However, the US share of that import demand has changed dramatically as a result of Don’s Party. Up to the end of May this year, US soybean exports to China were less than 6 million metric tonne (MMT), with a value of around US$2.7 billion. In volume terms that is almost an 80 per cent decrease compared to the three-year average of 29MMT for the same period.

It is no accident that the Chinese chose to impose tariffs on soybeans. The biggest producing soybean states are across the US Midwest, and this is The Don’s heartland. The farmers voted him into office. Beijing hopes that the farmer will either lobby Washington to solve the impasse or desert Trump at the ballot box in next year’s election.

So, what does The Don do to appease the US farmer? He announces another support package worth a monstrous US$16 billion, that’s what! According to a United States Department of Agriculture (USDA) announcement late last month, the latest Market Facilitation Program (MFP) payment “is aimed at supporting American agricultural producers while the Administration continues to work on free, fair, and reciprocal trade deals” with China.

This is the second round of trade assistance announced by the US in response to what Washington termed as “unjustified retaliatory tariffs” on agricultural commodities. The first program, totalling US$12 billion, was announced in August 2018, with payments made in the third quarter of 2018 and the first quarter of 2019.

Primary producers can qualify for payments ranging from $15 to $150 per acre for row crops under this year’s version of the MFP, with rates varying widely by county and region. The rates are based on the historical mix of crops produced by each county as well as USDA’s calculation of the impact on each commodity of unfair trade practices over the past ten years.

The first tranche of payments is expected to begin this month with a potential second wave in November and a third, and final, distribution in January 2020. The USDA said that the second and third payments could be cancelled if the trade war with China is resolved beforehand.

The irony is that recent research has found that 10 per cent of the recipients, predominantly large corporate farms, are receiving a whopping 54 per cent of the payments. The vast majority of US farmers, the smaller operators, those with the least ability to cope, but are copping the brunt of Don’s Party, have been abandoned as the payments are proportionate to farm size and success.

Call your local Grain Brokers Australia representative on 1300 946 544 to discuss your grain marketing needs.

Australian winter crop teetering as it enters spring…

Posted by | Weekly Commentary | No Comments

The annual Pro Farmer Crop Tour was conducted across seven of the most important corn and soybean states in the US last week. The results were released after the markets closed on Friday and, as most market pundits expected, came in lower than the recent USDA production estimates.

This year’s tour had more than 125 scouts representing 12 countries and included farmers, agribusiness experts, media, government and representatives of the financial industry. The scouts sampled around 3000 individual fields along 20 pre-determined routes across Illinois, Indiana, Iowa, Minnesota, Nebraska, Ohio and South Dakota.

Pro Farmer estimates the average US corn yield at 163.3 bushels per acre (bu/ac) or 10.25 metric tonne per hectare (MT/ha). This was 6.2 bu/ac (0.39 MT/ha), or 3.7 per cent lower than the most recent USDA forecast of 169.5 bu/ac (10.64 MH/ha). Total US corn production came in at 13.358 billion bushels, or 339.3 million metric tonne (MMT).
The soybean production estimate came in at 3.497 billion bushels or 95.2MMT. This was based on an average national yield of 46.1 bu/ac (2.89 MT/ha), 4.9 per cent, or 2.4 bu/ac (0.15 MT/ha) lower than the latest USDA mark of 48.5 bu/ac (3.04 MT/ha).

One key observation from the tour was the maturity of the corn crop. Many scouts put it up to three weeks behind the average for this time of the year in the regions worst affected by the delayed sowing. The eastern reaches of the corn belt were the worst affected, but the crop certainly improved in quality and maturity as the tour moved west.
The forecast for cooler weather in coming weeks will slow the maturity of the crop even more. With autumn fast approaching, the days are getting shorter, and the average daily temperatures are on the decline. This raises the concern of early frosts and the potential impact on final yields.

Here in Australia, spring is almost upon us. As the days get longer and average day temperatures increase the evapotranspiration rate of each plant rises significantly, increasing moisture demand of the maturing crop. The possibility of frost also becomes a significant production risk as the crop moves into its reproductive phase.

Rainfall last week has continued the hand-to-mouth pattern evident across most of Victoria, South Australia and Western Australia this season. The falls were generally less than 10mm with most of the more marginal cropping regions receiving less than 5mm. New South Wales didn’t fare as well with some minor falls limited to districts south of the Murrumbidgee River. Central New South Wales, northern New South Wales and all of the Queensland cropping areas received absolutely nothing.

Victoria is the pick of the states at the moment, with forecasts suggesting average to slightly above average production. All but the north-west corner has received at least 25mm of rainfall so far this month. That said, the picture is not uniform across the entire state. There are parts of the Western Districts that are too wet and conversely a significant portion of the Mallee is starting to struggle due to lack of in-crop rainfall.

In South Australia, it is also a tale of two stories. The South East, lower Mid-North, lower Yorke Peninsula and the lower Eyre Peninsula are all tracking along quite nicely, but the more northern production areas have only been catching the edge of each change and have been struggling for almost the entire season.
Primary Industries and Regions South Australia (PIRSA) released their latest crop estimates last week with the wheat crop currently estimated at 4.8MMT and barley at 2.2MMT. This would appear to be extremely optimistic based on the current state of the crop.

In Western Australia, most grain growers are in the game but, overall, the crop is running around three weeks behind average. The crop went in on time, but most of it was dry sown. The break didn’t come until late in the first week of June, so germination was delayed accordingly. Canola appears to have lost the most potential with poor germination in many paddocks and flowering running very late, especially in the Kwinana and Geraldton zones.

Southern New South Wales is starting to feel the pinch. Most of the crop south of a horizontal line through West Wyalong was planted, but rainfall registrations in most regions have been well below average through July and August. The crops in many areas are showing signs of stress and production potential is falling quickly.
Save for a few isolated areas, crop prospects in New South Wales north of that line are a disaster. Much of central and northern New South Wales have had less rainfall year-to-date than at the same time in 2018. Southern Queensland is no better. Less than 30 per cent of the crop was planted, and less than half of that still has some prospect of harvesting more than next years seed requirements, assuming adequate spring rainfall is forthcoming.

The big outlier across the entire country this year is the size of the area that will be cut for hay. In Western Australia, livestock producers have been forced to feed for a much longer period this year as the break came late and ensuing pasture growth was slow. Reserves have been depleted as a result and growers will be looking to restock.

The situation in the eastern states is far more dire. It was dry across all eastern states last year, and hay stocks were not replenished last spring. Back-to-back droughts in central and northern New South Wales and southern Queensland has sustained hay prices at extremely high levels for an unprecedented length of time.

For those doing the calculations, the high prices are certainly providing a significant incentive in many regions to minimise production risk by cutting their crops for hay rather than carrying through to harvest. This is especially the case where the crops are already under moisture stress and potential grain production is decreasing.

The entire Australian winter crop area is currently behind the eight ball in terms of year-to-date rainfall. While the drought area on the east coast is currently less than what it was last year, much lower production prospects in Western Australia and high demand for hay across the entire country means that above-average rainfall and a kind spring will be required to ensure that this season’s domestic winter crop production exceeds that of 2018/19.

Call your local Grain Brokers Australia representative on 1300 946 544 to discuss your grain marketing needs.

Chinese economy faltering as Don’s Party rolls on…

Posted by | Weekly Commentary | No Comments

News that a Chinese trade delegation had cancelled this week’s planned visit to farms in the states of Montana and Nebraska has put a dampener on the upcoming US-China trade negotiations. The delegation reportedly headed back to Beijing earlier than scheduled after mid-level talks wound up in Washington late last week.
The delegation was involved in preliminary trade talks with US officials to find a resolution to the ongoing trade war (Don’s Party) ahead of cabinet-level negotiations which are scheduled to take place in Washington in October. Their early departure has raised doubts about a possible breakthrough and sent US soybean futures more than 1 per cent lower in Friday’s trade.

High hopes were set for last week’s trade talks in Washington, which came after both sides softened trade tensions earlier this month with gestures such as tariff exemptions and delays. China purchased 600,000 metric tonne of US soybeans the previous week and said it would exempt American pork and soybeans from additional tariffs, taking effect this month, as a sign of goodwill heading into the talks.

The plan for the farm visit was only announced a few days earlier and the sudden change of plans appears to have come on the back of comments from US President Donald Trump (The Don) saying that he wanted a complete trade deal with the Asian nation, not just an agreement from China to buy more agricultural goods from the United States.
But both sides moved quickly over the weekend to indicate that the negotiations will continue, and that high level talks pencilled in for October would still proceed. The two countries agreed to keep communicating on related issues and discuss the details of the next round of trade talks.

Negotiators on both sides have continued to look for an avenue to resolve their differences as tensions ratcheted up a notch or two over the northern summer. Both the US and China want to see a resolution to the long running dispute, particularly with the United States heading into elections in 2020.

However, plentiful global grain supplies and declining Chinese demand has dulled their appetite for imports. Overall feed grain demand in China is expected to decline amid substantially lower domestic swine inventories due to the continuing African Swine Flu epidemic.

It seems that the biggest hurdle facing negotiators on both sides may be agreeing on the scale and ambition of any deal they try to formalise. China wants to agree on a partial deal that would head off Washington’s planned tariff increases on Chinese imports in October. ‘The Don’ clearly wants a far more comprehensive deal.

US soybean exports have been the hardest hit by Trump’s brinkmanship and the Brazilian farmer has been the biggest beneficiary. One of the best barometers of the degree of tension surrounding US-China trade negotiations this year has been port price premiums paid for Brazilian soybeans over US soybeans. When the tensions escalate, premiums develop at the Brazilian port of Paranagua over US Gulf ports. Similarly, when tensions diminish the premiums slowly fade.

These price premiums have risen and fallen within the context of global price movements that have centred on the progress of the 2019 US crop. Prices rose in both Brazil and the US as the early season wet conditions hindered corn and soybean planting in the US and high water levels in the Mississippi River raised the cost of moving old crop soybeans to US Gulf ports. As conditions have improved over the past couple of months, prices of both Brazilian and US soybeans have trended lower.

The rise and fall of the Brazilian export premium correlates directly with the rise and fall of trade tensions. In May this year, the US announced plans to raise tariffs on $200 billion of Chinese products from 10 to 25 per cent. Brazilian soybeans moved to a 7 per cent premium over US soybeans as a result. The premium gradually fell back to around 1 per cent by late July. However, a new round of tariff hikes that took effect on September 1 pushed Brazilian premiums up again to almost 10 per cent.

The concern for Australia is that any deepening of the trade impasse will potentially weaken an already vulnerable Australian economy. The trade crisis comes amid a weakened domestic housing market and stifled economic growth. The health of the Australian and Chinese economies is intricately linked. Our agricultural exports, mining exports, tourism exports and education exports all depend heavily on China.

As Don’s Party rolls on endlessly, China is beginning to admit its traditionally high rates of growth are in jeopardy. And the latest numbers tell the story. Industrial production growth fell to 4.4 per cent in August, its lowest in 17 years. Growth in retail sales also fell last month to 7.5 per cent. A lofty number by Australian standards but much lower than the 10 per cent growth consistently seen over the last ten years.

Beijing is now saying that it will be very difficult to grow at 6 per cent this year, well below the numbers seen in the years since the global financial crisis. If Chinese growth continues to decline it will undoubtedly be reflected in demand for Australian goods and will have countless flow on effects across the domestic economy.
The best result for all concerned, including Australia, would be a swift resolution to the standoff. No doubt this is front of mind for Prime Minister Scott Morrison as he tours the United States and meets with The Don.

Call your local Grain Brokers Australia representative on 1300 946 544 to discuss your grain marketing needs.

USDA corn numbers don’t lie! Or do they?

Posted by | Weekly Commentary | No Comments

The global grain markets were rocked last week when the United States Department of Agriculture (USDA) amended this season’s US corn production estimates, printing yield and area numbers much higher than the trade had expected.

The latest monthly World Agricultural Supply and Demand Estimates (WASDE) report was released on Monday of last week (Tuesday morning Aussie time) and it was generally expected to have a few surprises. Yet, an increase in corn production was the complete antithesis to industry wide projections.

The USDA decreased the corn area by a meagre 690,000 hectares to 36.42 million hectares. This area was far higher than the average trade estimate of 35.5 million hectares. The higher than expected area was a big surprise, but not as big as the increase in yield from 10.42 metric tonne per hectare (MT/ha) to 10.64MT/ha.

It is widely accepted that the corn crop was planted under less than optimal conditions, and it has not been a walk in the park for the developing crop since planting. If that is the case, it is difficult to swallow a projected yield that is only 4.5 per cent below the long-term average.

The net effect of the USDA changes was an increase in total corn production from 352.4 million metric tonne (MMT) to 353.1MMT when the average trade estimate had total production decreasing to 335.1MMT. Consequently, many don’t believe the USDA numbers and are expecting gradual downward revisions in coming months.
Maybe the Market Facilitation Program, designed to assist farmers affected by tariffs and reduced exports, provided a bigger than necessary incentive for farmers to plant regardless of the chances of crop success. But the prevent plant numbers (also released early last week) do not support that notion.

US farmers reported they were not able to plant crops on more than 7.9 million hectares this year. This is the highest prevent plant area reported since the Farm Service Agency (FSA) began releasing their report in 2007. It is also 7.08 million hectares more than was reported at the same time last year.

There is a saying that says numbers don’t lie, but these don’t seem to make sense. Corn made up more than 58 per cent of the prevent plant area or 4.53 million hectares. If you add that to the latest WASDE seeded area, it comes to a total of 40.95 million hectares.

This is 9 per cent higher than the 37.55 million hectares the USDA expected farmers to allocate to corn production in their May update, before the seeding program commenced. It is also be more than 5 million hectares above the previous record corn area.

US corn futures took a shellacking as soon as the WASDE report was released. The nearby contract was very quickly limit down (25 cents per bushel) and, despite a small rally on Friday, was down 8.8 per cent across the week. That represents the biggest weekly fall since June 2016.

The market has essentially fallen back to early May values, but production has fallen 29MMT and ending stocks are down by almost 8MMT over the same period.
The speculators in the corn market have had a rough time. They had a significant short position at the beginning of May. They lost money when the market rallied as planting conditions rapidly deteriorated. They spun around and went long only to get stopped out last week back near contract lows.

Where to from here? The market has lost around 100 US cents per bushel in the last eight weeks. Maybe it has done enough for now? With substantial scepticism around the high USDA numbers, the final disposition of the corn crop and the weather from here through to harvest, it would seem logical that a modest risk premium would be justified.
Wheat took a back seat to corn in the aftermath of last week’s WASDE report, but there were some significant revisions to global production. The production declines were led by Turkey, where a lower harvested area and poor yields led to a 2MMT reduction in output.

The USDA trimmed production in the European Union by only 1.3MMT to 150MMT, with the dry, sweltering June conditions having a much smaller impact than had initially been anticipated.
In the Black Sea region, Russian production was lowered by 1.2MMT to 73MMT, a far cry from the 80MMT being spruiked just a few months ago. The Kazakhstan wheat crop was reduced by 1MMT to 13MMT, but Ukraine bucked the regional trend with a 0.2MMT increase in production.

The picture in the Americas was positive, with US production increased by 1.6MMT to 53.9MT. Down in Argentina, the season continues to improve with another upward revision of 0.5MMT to 20.5MMT. Nevertheless, this is lower than the most recent Buenos Aires Grain Exchange estimate of 21.5MMT.

Australian production was left unchanged at 21MMT. Rainfall across much of the Western Australian, South Australian and Victorian production areas in the first half of August is keeping the crop ticking along, but we still need more rain and a kind spring to avoid a downward revision to production before harvest.

The overall impact of the revisions to global wheat production was a decrease of 3.4MMT from 771.5MMT to 768.1MMT. The key point here is that despite the decline, global production is still up by 37.5MMT year-on-year, carry-out is healthy at 285.4MMT, and the stocks-to-use ratio of 37.6 per cent is running at a historically high level.
Call your local Grain Brokers Australia representative on 1300 946 544 to discuss your grain marketing needs.

Kazakhstan increasing trade ties with China…

Posted by | Weekly Commentary | No Comments

Kazakhstan, one of the most important grain producers and exporters in the world, announced last week that it was aiming to triple its wheat exports to China to as much as 2 million metric tonne (MMT) annually, but no time frame was charted to reach the goal.

This announcement came in the same week that the USDA released its latest global supply and demand estimates and in Kazakhstan it cut the 2019/20 season wheat production by 1.5MMT to 11.5MMT. This is down from 14MMT last season, 14.8MMT in 2017/18 and well below the record of 22.7MMT produced in 2011/12. The decrease was blamed on deteriorating crop conditions after a sustained spell of dry weather ahead of harvest.

The USDA also decreased Kazakh exports by 1.3MMT to 5.2MMT on the back of the lower production number. To balance the books, the USDA increased 2019/20 opening stocks by 200,000 metric tonne, meaning that ending stocks were unchanged at 1.26MMT.

The Kazakhstan Ministry of Agriculture said that harvest is currently in full swing across all grain-producing regions of the country and it expected to export around 7MMT of grain and flour in the 2019/20 marketing year. The Central Asian nation is the world’s second-largest exporter of flour behind Turkey.

China is already a major importer of oil, gas and metals from Kazakhstan and in addition to wheat, the government said that they were looking to increase exports of barley, salt, meat, poultry and dairy products to China. Interestingly, Beijing only approved imports of Kazakh barley in late November last year, the same week that the anti-dumping probe was announced into barley imports from Australia.

Barley production is expected to be 3.9MMT this year, 1.7 per cent lower than last season’s record crop. The USDA increased both production and exports by 200,000mt in last week’s update. Iran continues to be the biggest importer of Kazakh barley, consistently buying upwards of 80 per cent of production each year.

The last republic to depart the Soviet Union in 1991, Kazakhstan is rich in natural resources and has enormous economic potential. It is the 9th largest country in the world with an area of 2.725 million square kilometers. But with a population of only 18.5 million, it has one of the lowest populated densities in the world at just seven people per square kilometer.
The agricultural sectors share of GDP is around 6 per cent, but like many of the former Soviet Union countries, Kazakhstan has enormous agricultural potential. The country is well endowed with fertile land but, like Australia, suffers environmental handicaps such as water availability and a harsh climate.

The total area suitable for primary production, including crops, pastures and grazing, notably the steppes, is approximately 222 million hectares. However, only around 24 million hectares, predominantly in the north of the country, is arable and suitable for broadacre cropping.Kazakhstan is a landlocked country, despite its access to the Caspian Sea. Remoteness from global markets and lack of direct access to ports are significant obstacles for grain exports. The country’s geographic isolation adds additional freight and logistics costs to both exports and imports.

Most Kazakh exports have traditionally been transported by road to neighboring importers such as Uzbekistan, Tajikistan, Afghanistan, China or barged across the Caspian Sea to the Caucasian countries of Azerbaijan, Armenia and Georgia.

Alternatively, grain exports make their way to Russian and Georgian ports on the Black Sea for shipment to international buyers such as Italy, Turkey, Tunisia and Sweden. Small vessels, up to 5,000 metric tonne, can also travel from the Caspian Sea to the Sea of Azov and then into the Black Sea via the Volga-Don Canal.

Increased trade relations between China and their Asian neighbors’ has been a focus for Beijing in recent years as they attempt to shore up alternative supply origins and pathways in the face of the trade war with the United States (US) and increased trade tensions with several other key suppliers.

This is where China’s Belt and Road Initiative (BRI) has the potential to be a game-changer for trade amongst many Central Asian countries, especially Kazakhstan. This ambitious project was the brainchild of Chinese President Xi Jinping. It focuses on improving connectivity and cooperation among numerous countries spread across the continents of Asia, Europe and Africa.
The initiative was announced in 2013 with the purpose of restoring the ancient Silk Road. The scheme involves building a big network of roads, railways, maritime ports, power grids, oil and gas pipelines, and associated infrastructure projects.

Five railway routes and six international highways currently pass through Kazakhstan, connecting China and other Asian countries with Europe and the Middle East. But China wants to improve the speed and efficiency of freight movements and two of the BRI high-speed land corridors, one road and one rail, go straight through Kazakhstan.
In addition to improving trade pathways and reducing the cost of imports, the multi-trillion-dollar initiative is expected to open up and create new markets for Chinese exports and those of many Central Asian states.

While China pitches the initiative as an all-inclusive project for regional development, many nations perceive it as a strategic move by the Asian powerhouse to achieve significance and control at a regional level, and to play a more significant role at the global level, by building and controlling a China-focused trading network.
Like Kazakhstan, Russia is also looking to take advantage of the changing international trade flows emanating from the US-China trade war by increasing grain exports to China. Russia is the world’s biggest exporter of wheat, and it expects Beijing to approve imports of wheat from all production regions of Russia within a year.
In fact, Russia probably represents the biggest challenge to Kazakhstan’s goal of substantially increasing wheat trade with China in the coming years.

Call your local Grain Brokers Australia representative on 1300 946 544 to discuss your grain marketing needs.

US-China trade war is now a love fest…

Posted by | Weekly Commentary | No Comments

World grain markets trod water early last week ahead of Thursday’s release of the October World Agricultural Supply and Demand Estimates (WASDE). Ramifications of same were quickly forgotten after the announcement on Friday (Saturday morning Aussie time) of an interim trade pact between China and the United States (US).

US futures were a sea of red on Thursday following the release of the WASDE report, with CBOT wheat, corn and soybeans closing down 9 cents per bushel (c/bu), 14¼ c/bu and 1¼ c/bu respectively. That all turned around on Friday after news of the trade deal broke with wheat up 16 ½ c/bu, corn gaining 18 c/bu and soybeans up 10¾ c/bu.

The Friday action was predominantly fund buying as they scrambled to cover their shorts. They are reported to have purchased 40,000 contracts of corn, 15,000 contracts soybeans and 10,000 contracts of wheat. This equates to 5MMT, 2MMT and 1.4MMT of corn, soybeans and wheat respectively. Not bad for a day’s work!

Political pressure had been mounting for both leaders to reach a compromise after economic headwinds had struck both economies in recent months. It also came at a time when both leaders were trying to deflect attention away from domestic issues; impeachment for Trump and unrest in Hong Kong for Xi Jinping.

Trump had been holding out for a comprehensive deal that addressed a range of concerns around Beijing’s management of its economy. The Chinese negotiators were equally resilient, responding to US threats of increased tariffs with new measures of their own and refusing to include many of the US concerns in negotiations.

In the end, it seems that they have settled on an interim agreement that involves China buying more US agricultural products and undertaking several minor measures to open up its economy in exchange for the United States waiving the planned tariff increase set to take effect this week.

According to President Trump, the agreement was going to be great for both countries and was “a great deal for world peace. You know there was a lot of friction between the United States and China, and now it’s a love fest.”

He said that Beijing had agreed to buy $40-50 billion worth of US agricultural products which was a massive win for the US farmer. With the summer crop harvest ramping up in the US at the moment it will certainly be welcome news across the US corn belt, a key area for Trump in his run for re-election in 2020.

With the details of the pact yet to be inked, the biggest concern, for now, is how long the renewed affections will last and whether the deal will ever be consummated.

Meanwhile, there were a few surprises in the United States Department of Agriculture (USDA) October WASDE numbers compared to the previous month. The corn yield was raised slightly from 168.2 bushels per acre (bu/ac) to 168.4 bu/ac. It may have been quite a minor increase, but the trade was expecting a decrease of as much as 3 bu/ac. The USDA did cut the expected harvested area by 200,000 acres leading to a fall in US production of 0.5MMT.

Global production was decreased by 1 million metric tonne to 1.104MMT with non-China production decreasing by the same amount to 850MMT. Ending stocks were up in Brazil and Mexico and down in the US and Ukraine. The net effect was a fall of almost 4MMT in global and non-China ending stocks to 303MMT and 107MMT, respectively.

On the soybean front, the USDA reduced the expected harvested area by 300,000 acres to 76.5 million acres and cut the forecast yield from 47.9 bu/ac to 46.9 bu/ac. This led to a decrease in US production of 2.25MMT compared to the September estimate. Production in all other major production jurisdictions remained the same month-on-month resulting in a global number of 339MMT.

Soybean ending stocks were reduced in the US by almost 5MMT. This was partially offset by increases in both Argentina and Brazil culminating in a net fall of 4MMT to just over 95MMT globally.

World wheat production was virtually unchanged at 765MMT, but the numbers for several of the major producers are questionable. The USDA reduced the Australian crop by 1MMT but still have us pencilled in for 18MMT. The crop in Australia is suffering big time at the moment, and anything above 16MMT would be a miracle.

Argentinian wheat production was left unchanged at 20.5MMT. However, the season has taken a turn for the worst in many areas with drought conditions expected to have a significant impact on final yields. The provinces of Cordoba, La Pampa and the west and south of Buenos Aires province are in serious need of rain to arrest the decline.

The Buenos Aires Grain Exchange have reduced their production estimate from 21MMT to 19.8MMT and called the wheat crop 23 per cent good /excellent, against 30 per cent last week and 37 per cent last year. The Rosario Grain Exchange have also cut their estimate by 1.5MMT to 20MMT. However, private forecasters are saying wheat production could already be less than 19MMT.

The biggest swinger in the world wheat space could be Russia. The USDA left production unchanged at 72.5MMT, but Russia’s Agriculture Ministry put production at 75.6MMT with 1-1.5 million hectares still to harvest. That means that the early season forecasts of a 78MMT Russian wheat crop is highly possible.

This all means that the world wheat balance sheet is burdensome. Production is 30MMt higher than last year, projected global demand has fallen by 8MMT since the June WASDE report, forecast exports have dropped 6MMT over the same period, and world ending stocks are now expected to be 4MMT higher year-on-year. Competition from the major exporters is increasing, but world stocks continue to grow.

Wheat is lacking a significant demand driver at the moment, and the overall landscape is only likely to change if there is a significant weather event to disrupt supply or a political event that interrupts traditional trade flows.

Call your local Grain Brokers Australia representative on 1300 946 544 to discuss your grain marketing needs.

Australia losing relevance as a global wheat exporter…

Posted by | Weekly Commentary | No Comments

The Australian Bureau of Statistics released their July export data last week and the grain numbers undoubtedly reflect the effects of last year’s drought and the many dilemmas for Australian exporters this year.

Wheat exports for July came in at 737,000 metric tonne (MT). This was up from the June number of just 585,000MT but well down on the 1.227 million metric tonne (MMT) exported in May, the biggest wheat export month of the current marketing season (October 2018 to August 2019).

Not surprisingly, Western Australia and South Australia accounted for almost the entire volume, shipping 494,000MT and 216,000MT respectively. The balance of 27,000MT were container shipments from east coast (Queensland, New South Wales and Victorian) ports.

In terms of destinations, Yemen, Vietnam and Japan were the biggest in July taking 113,000MT, 109,000MT and 83,000MT respectively. In June it was the Philippines, followed by South Korea and Japan with 216,000MT, 86,000MT and 81,000MT respectively.

Year-to-date wheat exports now stand 7.457MMT with 57 per cent, or 5.286MMT, shipped in the January 2019 to June 2019 window. Western Australia made up the lion’s share of Australia’s wheat production last year, and at a pinch under 6MMT, the state accounts for more than 80 per cent of national wheat exports this season.

South Australian wheat shipments stand at 1.102MMT since the beginning of October last year or around 15 per cent of national wheat exports. Total east coast wheat exports for the marketing year stand at just 355,000MT. The majority of that volume went out in containers, with Victoria accounting for 194,000MT, New South Wales 102,000MT and Queensland 60,000MT.

Exports of barley in July totalled 209,000MT, almost double the June shipments 113,000MT, with Western Australia making up more than 99 per cent of that volume. Malting barley made up 39 per cent of the July exports, and feed barley made up 61 per cent.

Japan was the biggest importer of Australia barley in July with 105,000MT shipped, followed by China at 62,000MT. This was the opposite of June, where China was the primary destination at 53,000MT, followed by Japan on 51,000MT.

Total exports of barley for the 2018/19 marketing year stand at a healthy 3.459MMT. December 2018 is the biggest month thus far at 1.107MMT, more than double the next closest month. The split between malting barley and feed barley is almost equal with 1.751MMT exported as malting and 1.708MMT exported as feed.

Western Australia has exported 3.143MMT of barley this season, almost 91 per cent of total Australian barley exports. At 279,000MT South Australian exports make up most of the balance, and Victoria has chimed in with 37,000MT of containerised trade.

Interestingly, China has been the biggest destination for Australia barley in the October 2018 to July 2019 window. They have taken 2.231MMT, or almost 71 per cent of total Australian barley trade to international clients. This is despite the ongoing anti-dumping investigation, which appears no closer to a resolution.

The investigation commenced in November last year, and the final decision of the twelve-month inquiry is due in November this year. However, Beijing can extend the investigation by a further six months, to May 2020, if they feel it is required.

While the potential outcomes remain uncertain, it appears that the Chinese government have their hands full on other fronts and are happy to let market speculation and confusion reign in the Australian market until a decision is announced.

On the canola front, July exports totalled 39,000MT, with one 33,000MT cargo loaded out of Western Australia and small parcels of container business out of both Victoria and South Australia.

Marketing season canola exports currently total 1.447MMT, with 79 per cent shipped from Western Australian ports and 14 per cent from South Australian ports. The balance of 7 per cent or 95,000MT were exported from Victoria with one bulk vessel in March and the rest via container trade across the season.

With a run of poor sorghum crops in northern New South Wales and Queensland, sorghum exports total a paltry 62,000MT for the first ten months of the marketing season. This is well behind last year and a long way short of the record 1.6MMT exported in 2013/14.

Last year may have been bad, but this season’s production outlook is not looking any better as the late winter dry continues into the spring. There are good pockets in most states, but widespread rains are required now, and then follow up falls for at least the next month to arrest the deterioration.

Australia has lost significant market share and relevance as a global wheat exporter as a result of last year’s drought and the considerable fall in the continent’s exportable surplus. A repeat of last year is a free leg up for the likes of Argentina and the Black Sea origins who have filled the void into Australia’s traditional Asian wheat consumers.

We have even seen export values out of both regions fall in recent weeks as the plight of the 2019 Australian harvest gets factored into global supply and demand calculations. One thing is for sure, winning back that business in the face of similar competition will not be easy when Australian production recovers.

Call your local Grain Brokers Australia representative on 1300 946 544 to discuss your grain marketing needs.

The small Australia crop is quickly getting smaller…

Posted by | Weekly Commentary | No Comments

Last year’s Australian winter crop production was the lowest in more than a decade after drought in the eastern states cut production to well under that required for domestic demand.

However, prospects for the 2019/20 season in Australia are now worse as the unseasonably dry August and September extends into October, sapping the early season yield potential and bringing crops to harvest much earlier than usual in many regions.
According to the latest Bureau of Meteorology climate update, rainfall is likely to be below average across most of the country for the remainder of 2019, with high chances of a drier than average October and November in particular.

They predict that daytime temperatures are very likely to be above average across Australia for the remainder of the year with a spell of hot weather likely in early October. These are precisely the conditions experienced in many districts over much of the last week, and this will hasten the ripening process in many regions.
The BOM expects that night-time temperatures will generally be warmer than normal and that a positive Indian Ocean Dipole (IOD) is highly likely to remain the dominant climate driver until at least the end of spring.

This gloomy outlook does not bode well for some late yield relief, and further reductions in production estimates are highly likely as the remaining crop moves swiftly toward harvest. Soil moisture levels have been below average across most of Australia’s farming area for most of the year, and the crop in many regions has simply run out of gas.
This fate has been borne out in the area that has already been dropped for hay, across all states. And the warm weather over the last week will no doubt force growers to a make further assessment of the yield prospects on crops still standing and weigh that up against potential returns being offered by an extremely buoyant hay market.
Production estimates are always a moving target, and this is no more apparent than in the current season. There is a wide variation in production estimates being tossed up by the trade and market analysts, but one thing is undoubtedly common for them all, it will be less tomorrow.

In late September I was thinking national wheat and barley production were around 16.50 million metric tonne (MMT) and 8MMT respectively. One week into October and I struggle to get the wheat crop above 15.75 MMT and the barley crop above 7.75MMT, such is the decline in the very short period of time. Falling production in both South Australia and Western Australia over the past few weeks have been the biggest contributors to that decrease.

So how will this affect trade flow over the next twelve months? Like last season, the market will be driven by the requirements of the domestic consumer. As national production decreases the exportable surplus will decrease, and any need to be competitive into Asia for anything but inelastic Australian demand will diminish accordingly.
In the 2018/19 season demand for grain in Queensland, New South Wales and Victoria far outstripped supply. This resulted in around 3.4MMT of grain, primarily wheat and barley, being shipped around the coast from ports in South Australia and Western Australia to eastern state ports. This was supplemented by around 300,000 metric tonne of rail movements and at as much as 500,000 metric tonne of road movements to east coast consumers.

In addition, the east coast supply deficit paved the way for the approval of milling wheat imports from Canada. The grain was shipped into Port Kembla and then taken by train to Manildra’s Shoalhaven starches facility at Nowra, a distance of around 70 kilometres.

While national production will be down year-on-year, the production landscape has changed. Total wheat and barley production in Western Australia will be down by as much as 5MMT and production of the same grains in the eastern states (including South Australia) will be up by around 3.0MMT, based on the aforementioned production estimates.
Demand tributary to the ports of Brisbane and Newcastle will be heavily reliant on coastal movements from Western Australia and South Australia, supplemented by rail and road movements from Victoria and South Australia. Manildra will continue to buy locally and has already booked more shipments out of Canada to meet their quality requirements.
How the trade reacts at harvest will be the most interesting market dynamic. With drought on the east coast last year many bought up big at harvest believing ownership would be king, only to see cash prices and basis drop dramatically in early 2019.

One would expect their approach to be a little more measured this harvest, especially with Western Australian values currently well above export parity and the delivered Queensland markets priced at, or close to, full execution from the west.

For the eastern state grower, it will be all about capturing the domestic premiums without taking on an undue amount of counterparty risk. This means that the highest price may not always be the best price. Many Victorian, New South Wales and Queensland producers will have existing end-user relationships and cash flow will be generated by selling into the domestic market direct off the header and then filling on-farm storages.

South Australia will be a little different. Pricing for the Eyre Peninsula and the Yorke Peninsula growers will be focussed on coastal movements through the ports to New South Wales and Queensland. The Adelaide zone grower may find an incentive to truck their production east. Better prices may be found at silos in Victoria or even New South Wales than at the local silo, especially at harvest time.

It may seem a long way to go, but from the right locations, the higher price should more than make up for the additional freight cost. If the grower doesn’t move the grain east, the trade will, so it is definitely worth doing the analysis and banking the spread if it is available. Better still, let your trusty grain broker point you in the right direction.
Agricultural production globally is at the whim of the weather. The one thing we do know is that drought-breaking rains in Australia are a day closer. In the meantime, the relatively small Australian crop is quickly getting smaller.

Call your local Grain Brokers Australia representative on 1300 946 544 to discuss your grain marketing needs.

Book Your Free Farm Visit or call us on 1300 946 544 for more information. Free Farm Visit